Why you need to calculate error bounds on your test metrics
Raza Habib
Why you need to calculate error bounds on your test metrics
Although it’s common to report test performance in machine learning, very few calculate the error bounds on their model’s test performance. If you think about this, it’s kind of crazy.
Your test estimate is the thing that gives you confidence in your model’s future performance. It’s what makes you feel safe deploying a model to production. But how do you know when to trust the test estimate itself?
How much you should trust your test estimate obviously depends in some important way on the size of the set. If your test performance is 90% on a test set that is only 10 data points large then you probably should be suspicious. On the other hand, if your test set contains thousands of data points and you get 90% test accuracy, you can be more confident that your model will have 90% accuracy in the future. We can quantify this intuition that larger test sets are more reliable by using confidence or credible intervals.
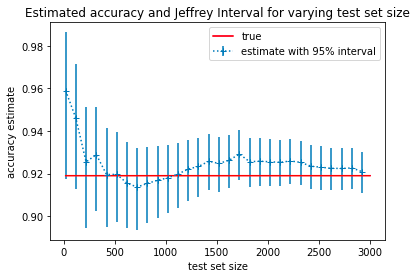
Credible intervals give you upper and lower bounds on your model’s performance. These bounds get smaller as your test set size gets bigger so they allow you to know when to trust your model and also answer a very common question: How big should my test be?
By putting credible intervals on your test metrics (e.g ), you can estimate how much test data you actually need. First decide what level of performance is required for your model to be useful and then increase the size of the test set till you are confident that the target performance level is within your credible interval.
How to calculate confidence intervals in practice
Calculating credible intervals for accuracy is fairly straightforward, even if the math behind it might seem complex. We’ll first show you how to do the calculation and then explain the math at the end of the article.
As an example, imagine that you wanted to classify hate speech as part of a content moderation effort. You’ve trained a classifier that takes in tweets and outputs one of two classes: hate-speech or not. We’ll show you how to calculate credible intervals for the accuracy of your classifier.
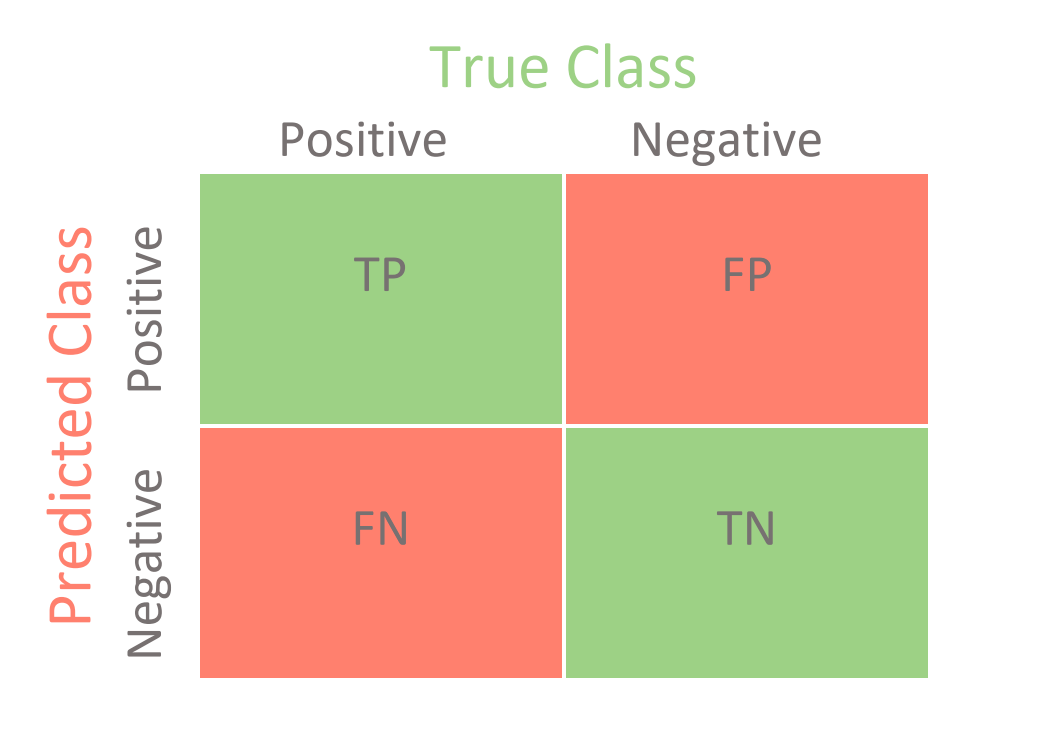
- First calculate the confusion matrix of your classifier on the test set. So for a binary classifier you would need counts from the test set of True Positives, False Positives, True Negatives and False Negatives.
- Once you have these numbers you can calculate a probability distribution over the accuracy of your model. The distribution will be a beta distribution. Beta distributions have two parameters, and . Set and .
- Once you have your Beta distribution you get the prediction for accuracy by calculating and you can get the upper and lower bound on your model performance by calculating the 2.5 and 97.5 percentiles of the distribution. You can do that using the following code block:
from scipy.stats import beta
def jeffreys_interval(N_correct, N_total, prior=(0.5, 0.5)):
  """Calculates the distribution over accuracy for binomial trials"""
  a, b = prior
  a += N_correct
  b += N_total - N_correct
  lower, upper = beta.ppf([0.025, 0.975], a, b)
  est = a/(a + b)
  return est, lower, upper
That’s it! If you follow those three steps you can easily improve how you report your accuracy metrics and have greater trust in your machine learning models.
Calculating test metrics with Active Testing
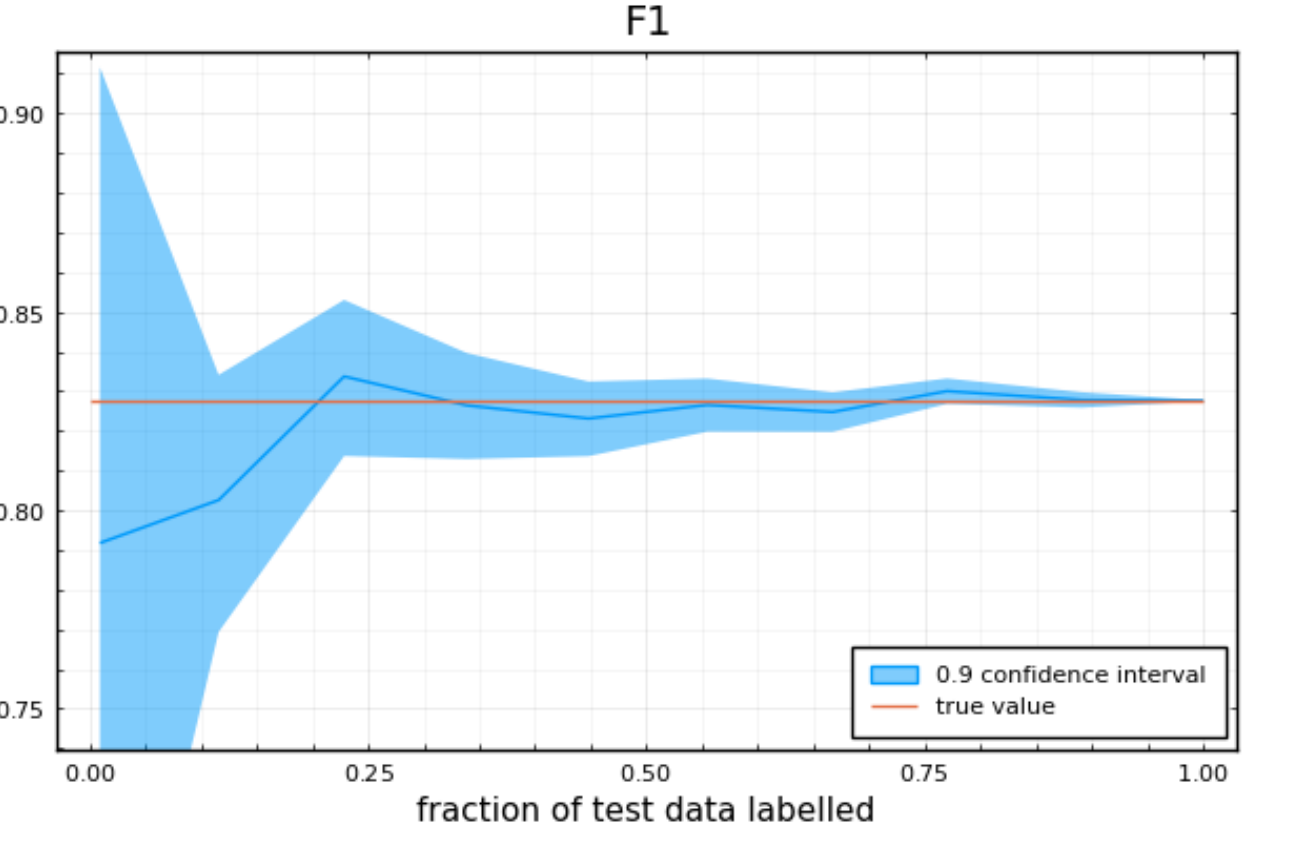
Calculating confidence bounds for accuracy is pretty straightforward but it turns out that as soon as you want more complicated metrics like F1, precision, recall or MaP there isn’t a straightforward closed form solution and this is why most teams don’t report them. This is also why we decided to build Humanloop Active Testing. Active Testing takes your test data and calculates both your test metrics as well as confidence bounds for you on a range of key metrics. More than that, it shows you how the error bounds change as you add more test data so you can understand if you have a big enough test set to trust your model.
Active Testing does a lot more than just calculate error bars for you though, it helps you construct a good test set in the first place. Most ML teams build their test set by careful manual annotation of a random sample of data. The problem with this approach is that real world data tends to be very imbalanced. This makes it hard to measure performance on rare classes without labeling a very large quantity of data.
Active Testing uses our recent research to help you work out which data is most valuable to include in your test sets. You simply upload your unlabeled data, alongside predictions from your model and we tell you which data points you should label. You can even do the labeling with a team in our annotation interfaces. Using Evaluate you can build a test set that gives good performance estimates with up to 90% less labeling than if you were to select your data at random.
There’s no reason not to calculate credible intervals
Credible intervals are a simple solution to a very tricky problem in machine learning — when to trust your models. They’re easy to calculate for accuracy and for more complex metrics like F1, tools like Active Testing are on hand to help. Once you have credible intervals on your test metrics it’s also a lot easier to know if your test set is large enough to accurately estimate future performance. If you want to go one step further, you can also use methods like Active Testing to choose the optimal data points to include in your test set. These methods are built into Humanloop Evaluate and can save you 90% of your annotation efforts for testing.
References
https://en.wikipedia.org/wiki/Binomial_proportion_confidence_interval
About the author